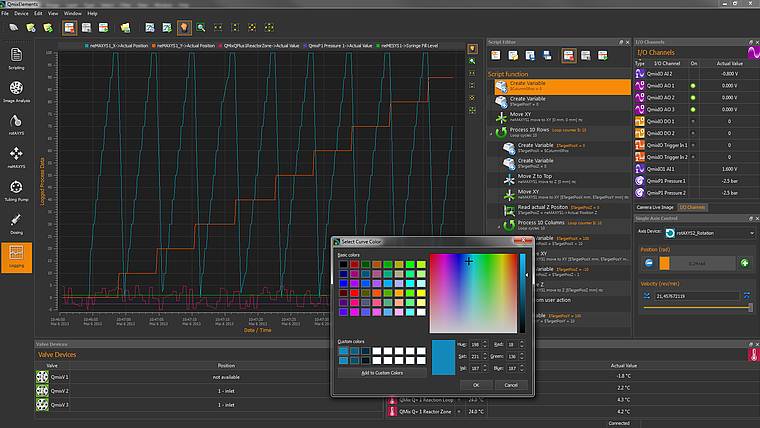
With the process data diagram plug-in, you can record process data from any device (e.g. current axis position, syringe fill level…) or the values of I/O and controller channels (analog or digital inputs/outputs). This enables you to visualize, record and constantly log changes in the process data over time.
- simple configuration via drag & drop
- Save the diagram in different image formats (PNG, PDF…)
- Steplessy zoom in or out with mouse wheel
- easy navigation in the diagram
- Show/hide individual curves
